
 Reversal Lead to a Stock Market Drop?")
The stock market is up incredibly.
And as we have repeatedly noted, the bull market is set to rise even higher. Technology stocks led the waySemiconductor stocks to be exact.
So with stock indexes taking a breather, it makes sense to keep an eye on market-leading sectors, which could drive stock prices higher, but also signal concern.
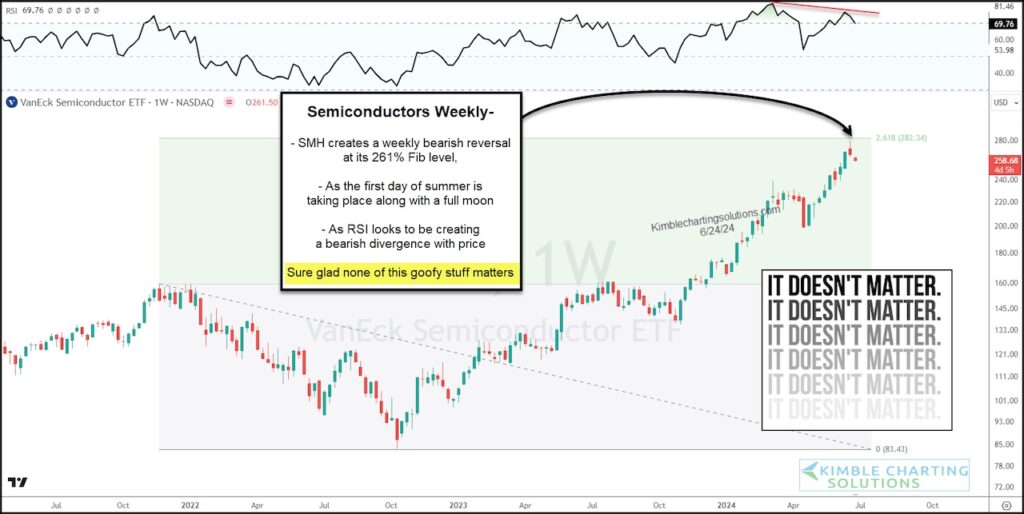
Today we look at the “weekly” chart for the Semiconductor ETF (SMH): Should active investors be concerned here?
SMH has made a bearish reversal at the 261% Fibonacci price level…which also occurred on the first day of Summer and a full moon! Also, the Relative Strength Index (RSI) appears to be making a bearish divergence.
Does this silly story matter? It doesn’t matter… until it does. Stay tuned!
Semiconductor Sector ETF “Weekly” Chart
KimbleCharting is offering a free two-week trial to See It Market readers. For more information on setting it up, please email us at services@kimblechartingsolutions.com.
twitter: translator
The author may hold positions in the securities mentioned. The opinions expressed herein are the author’s alone and do not in any way represent the views or opinions of any other person or entity.