

PM Images
Overview
Dividend growth investing can be such an amazing strategy when practiced over long periods of time. Constructing a portfolio of dividend payers that provide you with a growing stream of dividend income has the ability to eventually reach a point where the income can pay all of your bills. As investors, I think a lot of us strive to eventually reach this point, but it can be sometimes difficult to actively manage your portfolio and know which companies to hang on to and which to cut loose. The Vanguard Dividend Appreciation ETF (NYSEARCA:VIG) can take all of the guess work out for you.
I previously covered this ETF back in November 2023 and focused on the quality of the companies within, stating how an investment in VIG is essentially a bet on the U.S. economy. While I still believe this to be true, I thought it would be a good time to revisit VIG and this time focus on the dividend growth aspect that VIG can deliver since economic conditions have shifted over the last few quarters. I believe that VIG can not only provide you with superior diversity across sectors, but also have the growing power to snowball dividends into a large source of passive income.
The income component of investing is something that I will forever preach as important. Receiving a steady stream of cash flow from your investments can psychologically make it easier to be a long-term investor, help resist making any quick decisions in the heat of volatile markets, and also has the potential to grow to a large enough size to start paying some of your expenses during retirement. VIG is a great tool to capture instant diversity across many sectors while also addressing this income aspect.
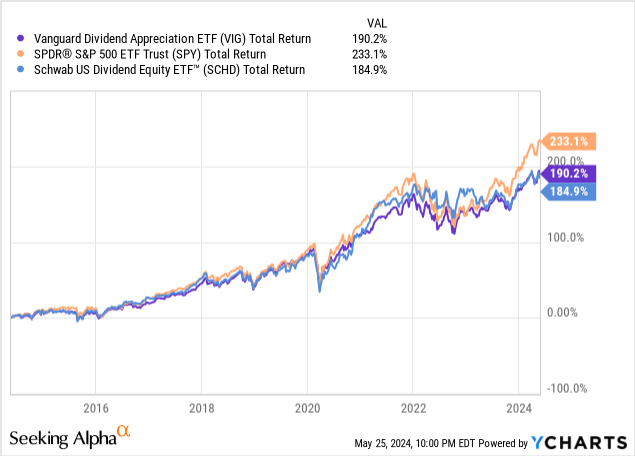
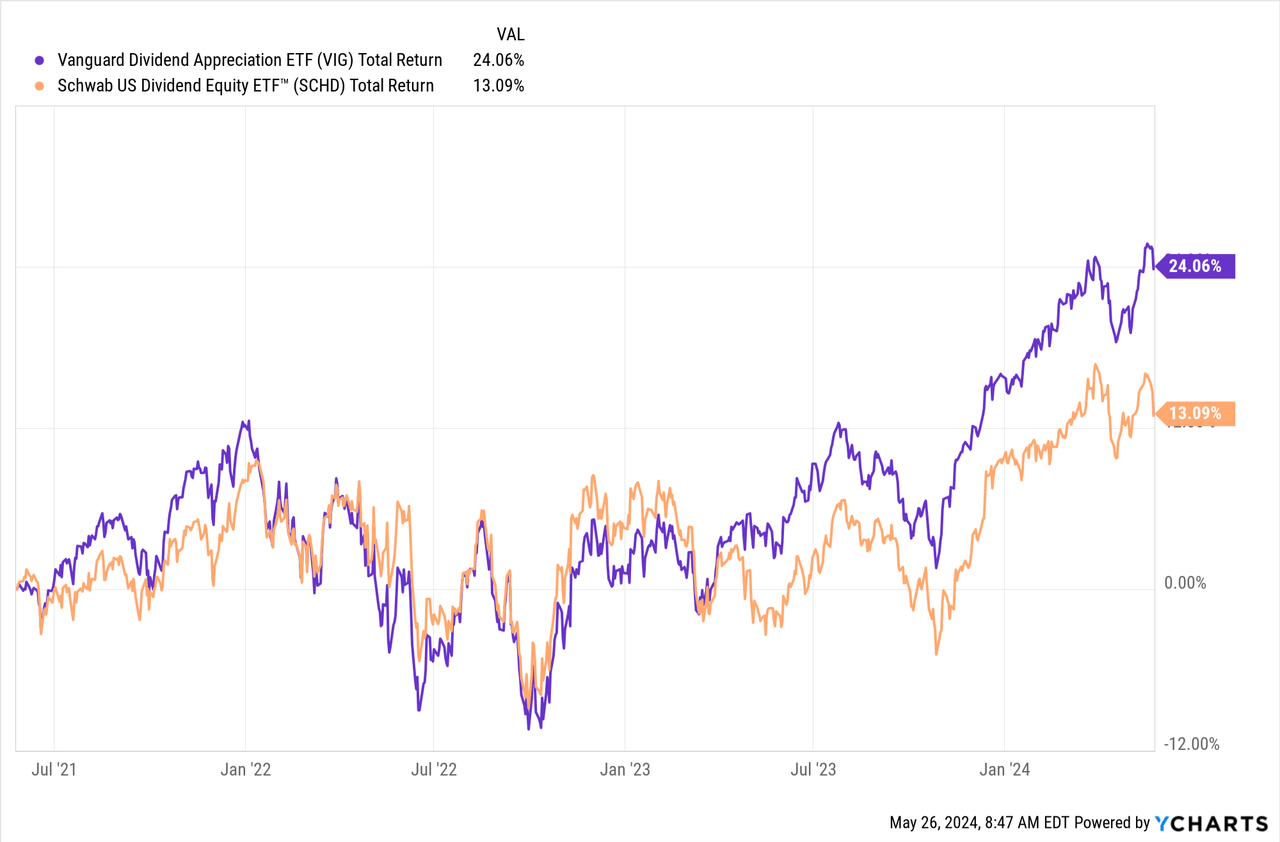
Even though the starting yield is low, I propose that dollar cost averaging into this fund can provide superior results over time. We can see that even though VIG underperforms the S&P 500 (SPY) over the last ten-year period, it also outperformance Schwab’s U.S. Dividend Equity ETF (SCHD). For reference, SCHD’s dividend is almost three times as large as the yield produced from VIG.
Additionally, VIG is very cost-efficient, with a total operating expense at only 0.06%. The fund has a primary goal to track the performance of the S&P500 Dividend Growers index by maintaining exposure to large cap companies that have long track records of raising their dividend distribution amount year after year. As a result of this focus on consistent dividend growth, the companies within VIG tend to have very solid free cash flow growth as well. They determine the holdings within by running proprietary software and different formulas. Therefore, there are no active managers for this ETF.
Dividend Growth
The dividend for June has not been announced yet but as of the latest declared quarterly dividend of $0.7692 per share, the current dividend yield sits around 1.7%. While this tiny dividend yield leaves a lot more to be desired, the growth is where the real magic is at. VIG has issued out dividends for a total of 17 years but has only maintained a consecutive increase streak of 10 years. Over those ten years, the dividend as increased at a CAGR (compound annual growth rate) of 8.49%.
VIG 2023 Annual Report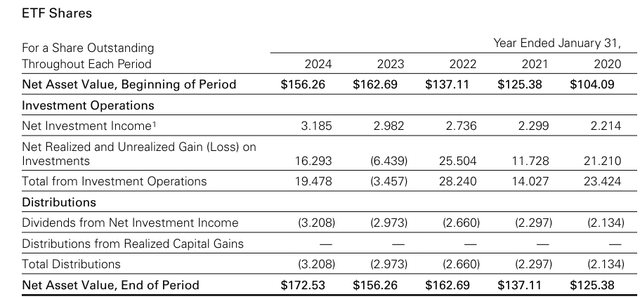
Taking a look at the latest annual report for 2023, we can see that net investment income has steadily increased year over year, as well as the total distributions paid out to shareholders. For the 2024 data, we can see that net investment income was $3.185 per share while there was a large increase of net realized gains totaling $16.293 per share. This means that the distribution is almost covered entirely from the net investment income at the moment while net realized gains can be used to make up the difference in what remains for the distribution.
There has never been a year where the combination of both net investment income and net realized gains was not able to fund the distribution. Something that I like is that the fund may strategically store excess net realized gains in the form of cash to help offset any lackluster performance of net investment income or realized gains in a future year.
Looking at the same 2023 annual report, I notice that the dividend is 100% classified as ‘ordinary dividends’ rather than qualified dividends. This is important to consider because ordinary dividends have more unfavorable tax consequences compared to qualified dividends. While the tax drag can be offset by holding in a retirement or tax advantaged account, it’s worth mentioning for those of you who may be considering buying this in a regular taxable account.
VIG 2023 Annual Report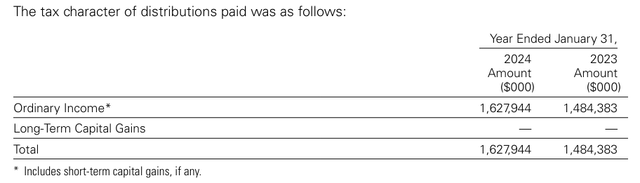
To demonstrate the kind of growth I am talking about, I decided to back test some data and returns with VIG using Portfolio Visualizer. Let’s say that you made an original investment of $10,000 back in 2015 and continued to dollar cost average into this position $500 every single month from then until now. In addition, let’s also assume that you reinvested every dividend received for each quarter.
Sticking with VIG over the last decade would not only have resulted in a position size over $130k today, but it would have also resulted in your dividend income growing by over 7x. In 2015, your dividend income received would have totaled $302. Fast forwarding to 2023, your total dividend income received would now be $2,266
Portfolio Visualizer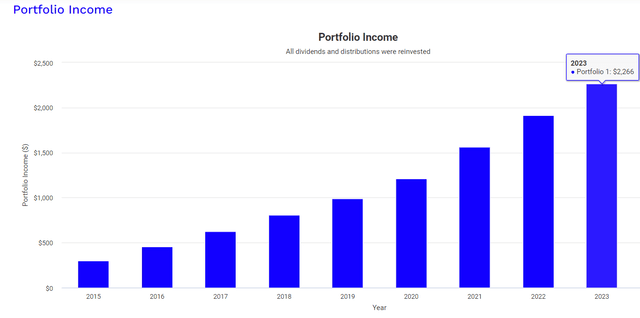
This dividend growth was a result of a modest $500 commitment every month. If you are a high income earner and have the disposable income, imagine the growth that a higher monthly commitment would result in. I believe that an ETF as diverse as VIG has the ability to offer capital appreciation that is similar to a more traditional S&P 500 focused ETF but also has the added bonus of creating an income stream large enough to actually be meaningful when you reach the phase of your life when you will start taking distributions from your portfolio.
Updated Portfolio & Positive Factors
Since the time of my initial coverage, there have been some shifts within the top holdings of VIG that I believe to be for the better. VIG currently has 340 individuals stocks within and sits at a market cap of $184.3B. The fund sits at a current price to earnings ratio of 23.1x, which aligns with the S&P 500 dividend growers index of 23.1x. Here is an updated snapshot of the top ten holdings. Just to better visualize the changes within, I will include the difference in weighting between now and when I last covered VIG over 6 months ago.
| Ticker | Holdings | Current % of fund | Difference % |
|---|---|---|---|
| (MSFT) | Microsoft Corp. | 3.87% | -0.98% |
| (AAPL) | Apple Inc. | 3.81% | -0.51% |
| (AVGO) | Broadcom Inc. | 3.43% | +1.04% |
| (JPM) | JPMorgan Chase & Co. | 3.33% | +0.30% |
| (XOM) | Exxon Mobil Corp. | 2.84% | -0.55% |
| (UNH) | UnitedHealth Group Inc. | 2.69% | -0.67% |
| (V) | Visa Inc. Class A | 2.44% | -0.11% |
| (PG) | Procter & Gamble Co. | 2.31% | -0.18% |
| (MA) | Mastercard Inc. Class A | 2.24% | -0.14% |
| (JNJ) | Johnson & Johnson | 2.09% | -0.61% |
We can see that a lot of the holding weights have been slightly reduced, making this a bit less concentrated. The sector weightings remain consistent with a primary focus on technology stocks. Technology makes up 22.10% of the fund’s weight, closely followed by financials accounting for 20.20% and healthcare making up 16.20%. VIG provides instant diversification across these industries, but I do think that future additions to the holdings may help VIG capture additional upside movement.
As the focus of the fund is on companies that have consistent levels of growing cash flow, this also means that these companies typically appreciate in value year after year. I went through all pages of their holdings and three notably companies came to mind that were missing within VIG’s holdings.
- Nvidia (NVDA)
- Meta Platforms (META)
- Alphabet (GOOG)
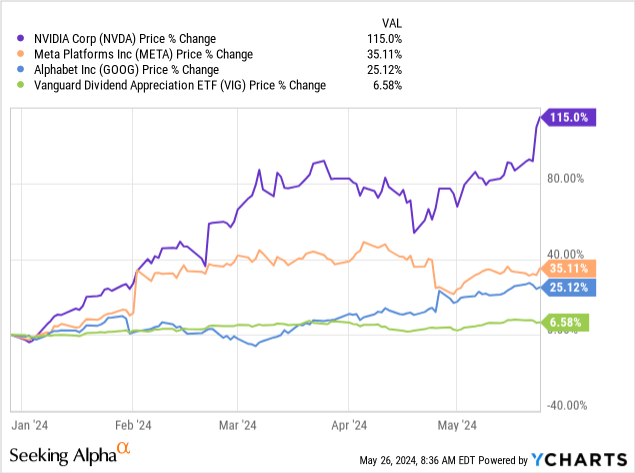
These companies have all delivered massive growth on a YTD basis and also pay a dividend. Meta recently initiated a dividend of $0.50 per share alongside the announcement of $50B buyback. Similarly, Google also initiated a dividend for the first time in its history $0.20 per share alongside a $70B buy back. Lastly, Nvidia recently raised their dividend by a massive 150% to $0.10 per share. While VIG requires at least ten years of consecutive raises, I only mention this because I believe the stakes are now raised. With such massive high growing companies now paying a dividend, these high volatile and fast growing companies may eventually be included within VIG.
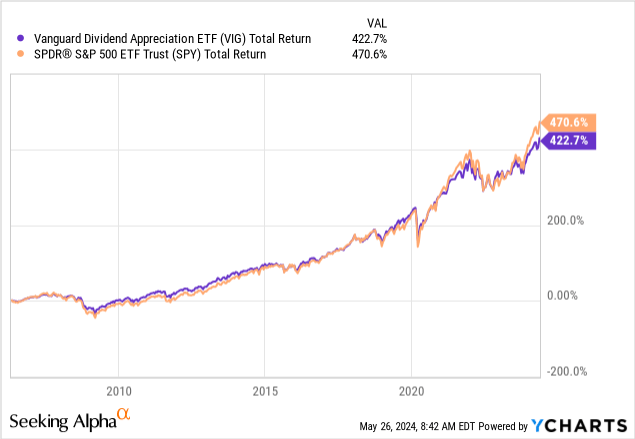
Over time, VIG has stayed relatively on par with the S&P 500. However, the total return slightly underperforms because of the income focus here. However, with such a large window of opportunity over the next ten years, the inclusion of additional tech companies could help close this performance margin. With the growth of the AI market estimated to grow at a CAGR of over 28% from now through 20230, we will likely see massive growth within the tech sector.
When it comes to dividend focused ETFs, you are usually giving up a lot of exposure to the tech sector, since tech companies aren’t known for their dividend consistency. For example, let’s take a quick look at the holdings for the most popular dividend ETF out there, Schwab’s US Dividend Equity ETF. We can see that VIG has outperformed this over the last three years, and I believe this is primarily due to the different sector allocation.
SCHD has only a 9.23% exposure to tech, and it instead chooses to focus primarily on financials and healthcare. The holdings breakdown also suggests that SCHD focuses a lot more on defensive sectors such as industrials, consumer defensive, and energy. This is a prime example of how the sector allocations make a big difference because even though SCHD’s starting dividend yield of 3.4% is higher than VIG, the total return was not as large because it failed to capture the upside movement that VIG was able to capture due to the exposure to tech.
Seeking Alpha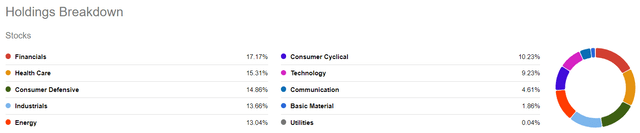
Downside
Even though VIG has the power to provide a total return encompassing both price appreciation and dividend growth, there is the downside of the low starting yield. Since the starting dividend yield remains low, to see any meaningful levels of income you would need to either have millions of cash to invest or you would need to have plenty of time on your side to let the compounding do its thing. Therefore, VIG is probably not the best choice if you are retired and looking for a fund that can generate you as much sustainable income as possible.
For reference sake, the average annual salary in the US is about $64,000 a year. If you wanted to generate this amount of cash flow with an investment, here is the amount of capital you would need invested to do so. I have provided some alternatives for comparison sake to also display how the starting dividend yield can make a large difference.
- Vanguard Dividend Appreciation (VIG): With a current dividend yield of 1.8%, you would need $3.55M invested.
- Schwab U.S. Dividend Equity ETF (SCHD): With a current dividend yield of 3.4%, you would need $1.88M invested.
- Vanguard Real Estate Index (VNQ): With a current dividend yield of 4.2%, you would need $1.5M invested.
- VanEck BDC Income ETF (BIZD): With a current dividend yield of 10.4%, you would need $615k invested.
VIG is the better choice if you have time on your side to let the compounding work its magic. If you don’t have time, there are plenty of other asset classes out there that can help you achieve a higher level of income such as REITs, Business Development Companies, and Closed End Funds that have an emphasis on income generation for shareholders.
Takeaway
Vanguard’s Dividend Appreciation ETF has the power to grow your income over time while giving you exposure to some of the best companies in the world. I really like how this ETF does not sacrifice exposure to the technology sector in exchange for a higher upfront dividend yield. The exposure to tech has helped VIG capture both upside price movement and dividend growth at a rate that has the power to compound your income with a continued commitment and long-term stance. In addition, the upside price that was captured has helped VIG surpass SCHD in total returns over the last few years. As demonstrated, dollar cost averaging into VIG can produce a growing snowball of dividend income. The dividend has grown at a CAGR of 8.49% over the last decade, and I anticipate this number to grow as more time passes and more high quality companies are eventually added within the holdings.