

Although the stock market appears to be recovering, worrying trends have emerged that could spell disaster for the industry, signaling uncertainty.
In particular, data shared by the Capital Markets Commentary Platform on June 16th stated: Kobeisi’s letter The current state of the S&P 500 is proving to be strikingly similar to the 2000 dot-com bubble.
Only 30% of S&P 500 stocks have outperformed the index so far this year, according to the data, a slight improvement from the 29% recorded in 2023 and signaling another year of unusually narrow market breadth.
The significance of this trend is particularly evident when looking at historical data from 1990 through June 2024. Historically, the median percentage of S&P 500 stocks that outperform the index has been 49%, indicating robust and broad-based market participation.
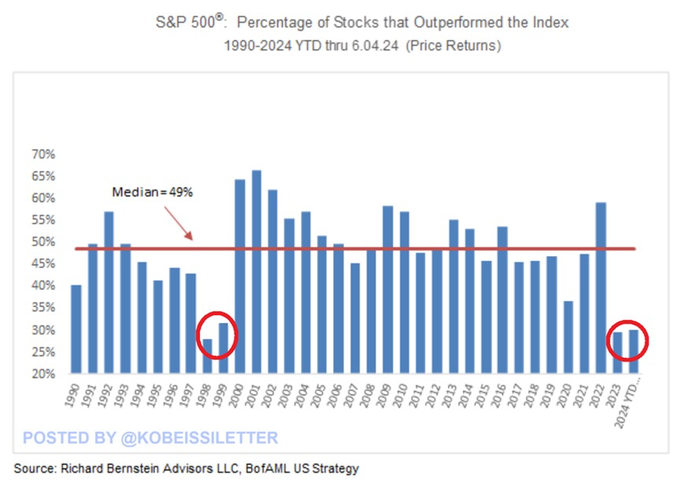
In contrast, the consecutive declines in performance seen in 2023 and 2024 are reminiscent of a similar pattern last seen during the infamous dot-com bubble of 2000.
While most years since 1990 have seen a healthy distribution of top performers, the periods 1998-1999 and 2023-2024 stand out for their significantly lower percentages. The dot-com bubble similarly saw profits concentrated in a small number of stocks, resulting in a market characterized by a narrow band of dominant stocks and, ultimately, significant volatility.
The trend is especially worrying given that the S&P 500 is up 12% year to date, and that surge has been driven primarily by a handful of big tech companies. This concentration raises questions about the sustainability of the gains.
This is similar to the circumstances that led to the collapse of the dot-com bubble, when the market relied on a small number of high-flying stocks, leading to a sharp correction when those stocks fell.
Generally, a narrow range suggests that while the index is rising, the gains are not widely spread across the market, increasing the risk of volatility if a few major stocks fall.
Tech stocks dominate the S&P 500 index
Indeed, the recent rise in the index has been driven by technology stocks, with companies moving into artificial intelligence (AI) making the biggest moves. For example, semiconductor giant Nvidia (NASDAQ: NVDA) has seen a short-term surge, with its market cap exceeding $3 trillion for the first time. Apple (NASDAQ: AAPL)’s market cap has also exceeded $3 trillion for the first time since January, as the two companies compete to become the second-largest company in the world.
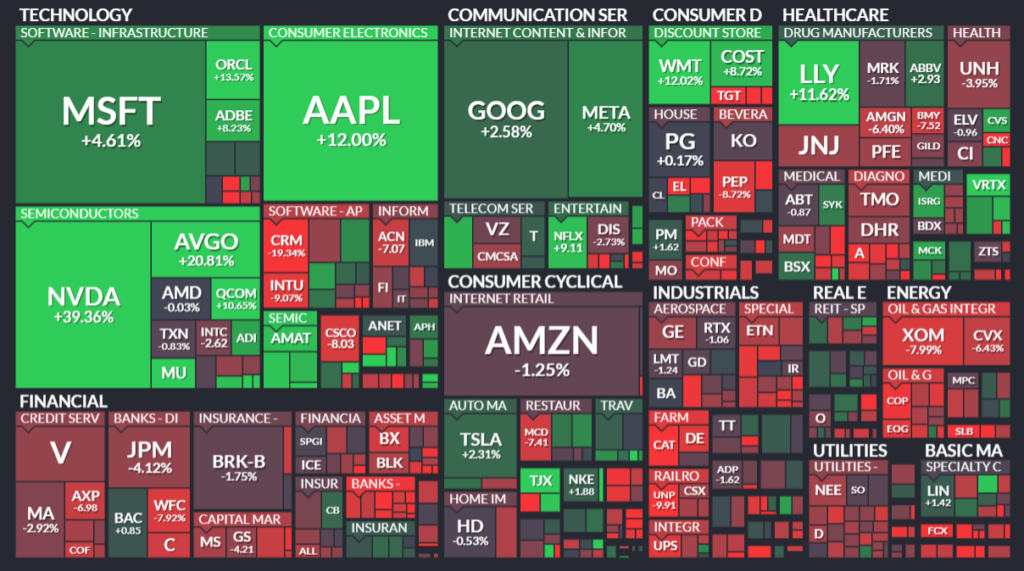
Overall, the performance of the index is highly dependent on a handful of companies, and this concentration in a few companies carries significant risks, adding to the uncertainty given widespread concerns that the AI stock bubble may burst.